
Measured: iPhone 17 Pro microphone frequency response and directivity
Frequency Response
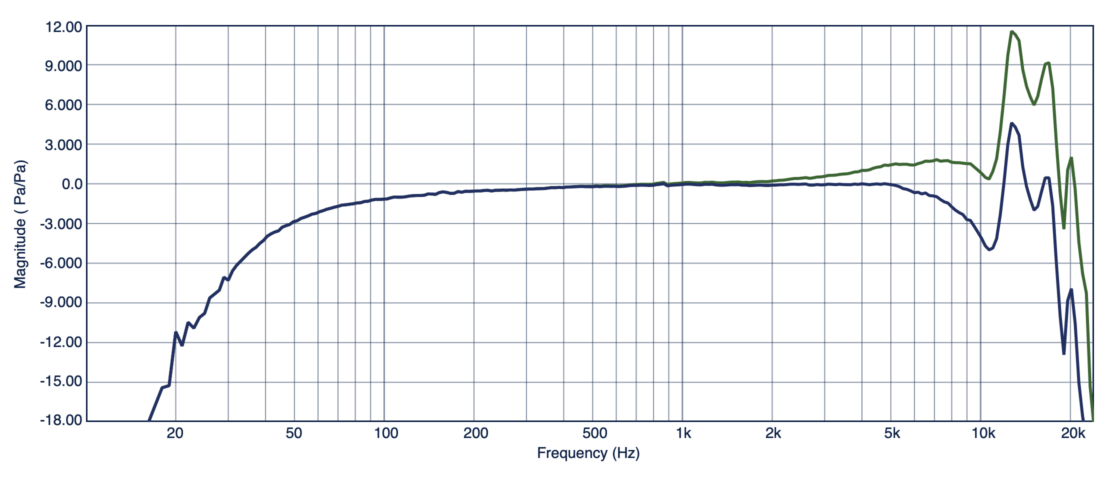
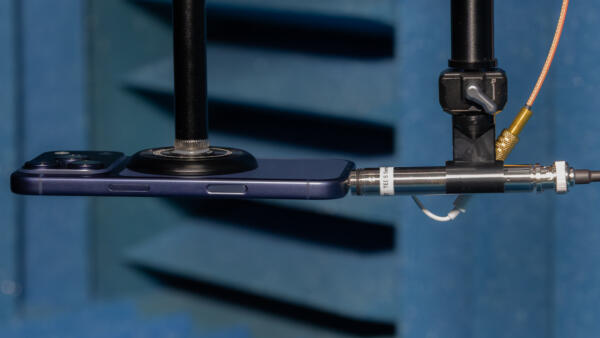
I measured the frequency response of the iPhone 17 Pro microphone by positioning a lab-grade reference microphone (PCB model 378B02) approximately 1mm away from the phone (facing the mic) in our anechoic chamber. The reference mic was connected directly to input 1 of a model 485B39 dual channel USB interface. The iPhone microphone signal was routed directly to a USB-C to 3.5mm headphone adapter using SignalScope’s audio play through function (with measurement mode enabled) and from there to input 2 of the 485B39. The response between the 2 microphones was measured with SignalScope’s Dual FFT Analyzer (on a Mac) with the microphones facing toward and away from a loudspeaker which was generating a swept sine excitation signal. The 2 microphone jig was rotated 180 degrees between measurements and the individual measurements were then averaged. The average measurement was corrected with the factory-supplied frequency response of the reference microphone for both pressure and free-field acoustic sensitivity. The graph, below was generated with SignalScope.
Directivity
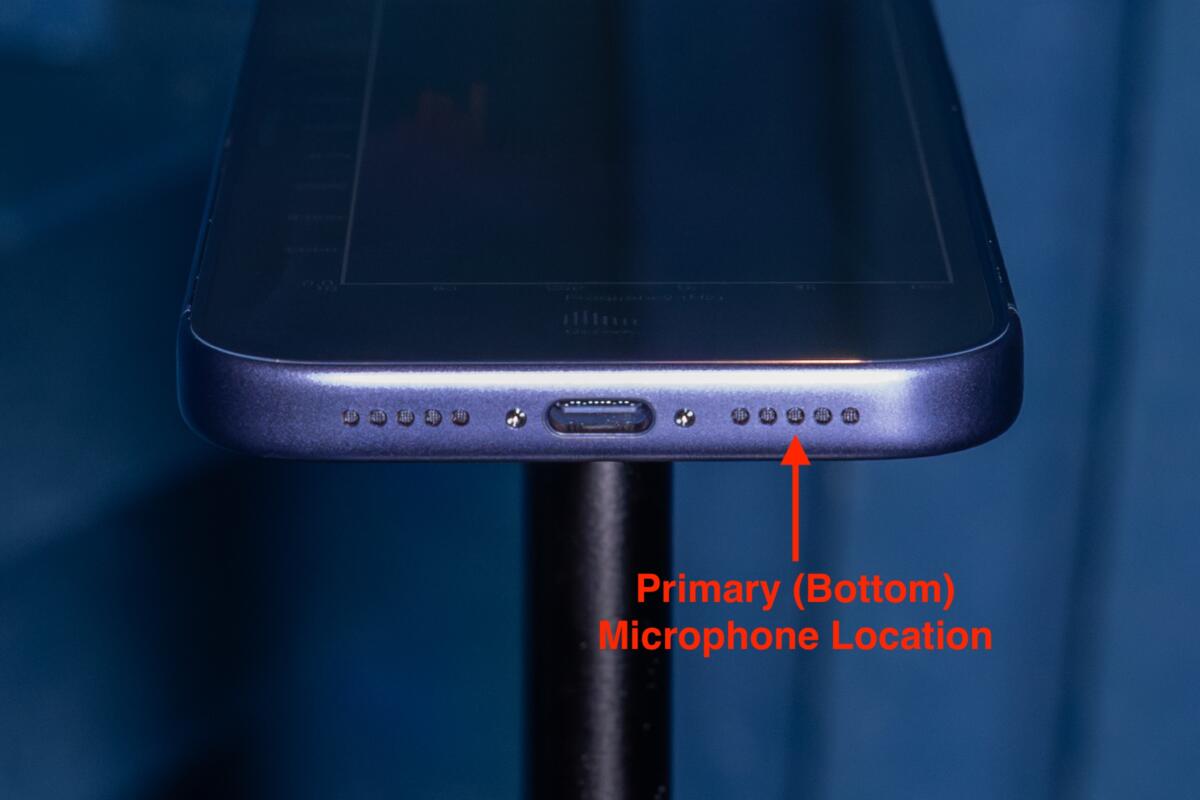
One obvious change in the iPhone 17 Pro microphone is that it sits on the opposite side of the USB-C connector than in previous iPhone models.
Our automated directivity measurement system, built into our anechoic chamber, made it easy to account for the change in microphone location. The 1/3 octave sound levels were measured as the phone was rotated around its microphone at 1.5 degree increments. A single, full-range, coaxial-driver loudspeaker generated the broadband test signal that ran for the duration of the measurements. Spectra in all resulting measurements were then accessed to generate a set of polar data for each frequency band. Several of these polar data sets were loaded into SignalScope’s Polar Plot tool to generate the graph, below.
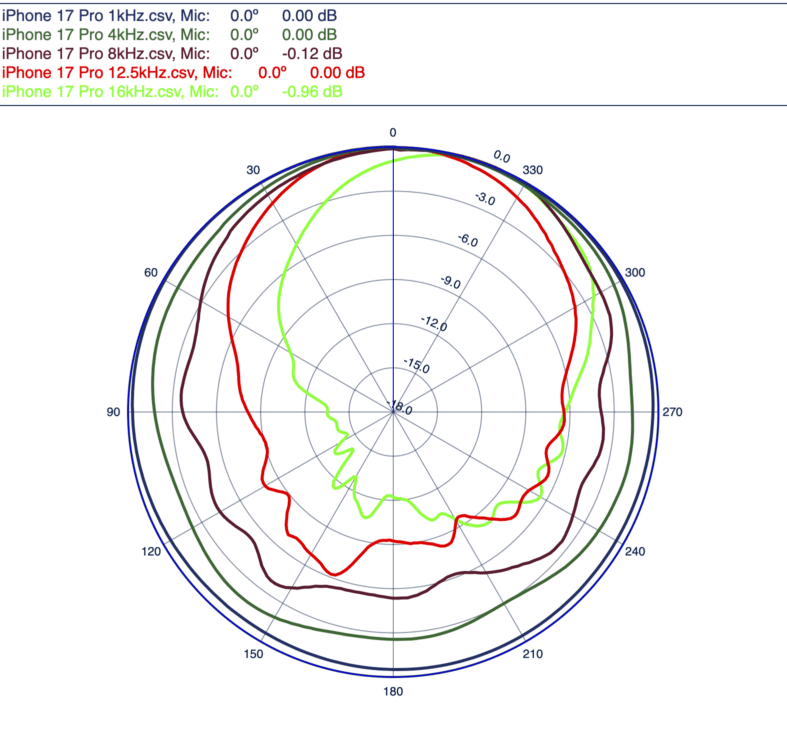
Note: 1/24-octave smoothing is applied to the frequency response data. No smoothing is applied to the polar plot data.

I’m a little surprised and even puzzled by these results. I expect to comment more on this in the near future (with more graphs, of course).
Looks pretty good to me, especially for its intended use – voice communication. Those wild swings above 10 kHz are diffraction effects, where the sound field interacts with the physical surface of the microphone, Research mics like PCB fiddle with diaphragm tension and other tricks to smooth these out. Also, don’t take the grid off of the PCB mic – that’s one of the tricks.
The variations in the high frequency response are significantly greater than those in previous iPhone Pro models (which were measured relative to the same PCB mic in the same manner)–that’s the concern. The directivity at 16 kHz is also a puzzler.
As for the grid, or screen, which covers the PCB mic diaphragm, that begs the question of the best way to measure the response of the iPhone microphone. In the IEC 61094-5 standard, under “Principles of pressure calibration by comparison,” it states, “the pressure sensitivity can only be realised in principle for microphones from which the protection grid can be removed and the diaphragm exposed to the sound pressure stimulus.” Removing the grid allows for the microphone diaphragm to be placed closer to the iPhone microphone, which should increase the likelihood of the two mics being exposed to the same pressure. However, the standard is designed for microphones with circular shape and generally, though not in all cases, they are expected to be of the same size (diameter). Clearly, a MEMS microphone embedded in an iPhone doesn’t meet this expectation.
Do we know if this looks to be a hardware limitation, or a EQ/processing issue? In comparisons, I’m finding the 17 Pro’s recording quality substantially below that of the 16 Pro.
I appreciate this article and analysis, seems like it is the only one on the Internet with regards to microphone quality for iPhones.
I noticed the findings here immediately after recording bits of a live show last night versus my iPhone 15 Pro Max and iPhone 16 Pro Max.
Is there any reasonable hypothesis for this issue? My concern is that Apple is using cheaper microphones this time around. Some folks on reddit noted that removing Wind Noise Reduction and setting recording to Stereo on the Camera settings have had reasonable improvements. Is it possible to perform response tests from a direct recording or passthrough with these two settings changed?
I really hope this is a software issue and is fixed with a software update. Wouldn’t make sense for Apple to include a microphone that yields these poor results unless there was a lot of BOM cost to save.
If I understand the measurements correctly then you have placed the reference microphone and iPhone microphone in front of each other when doing the measurements. This means that (potentially multiple) reflections will bounce off the two microphones/surfaces giving spurious results above 10kHz. Can you repeat the measurements with the iPhone only and reference microphone only (or is that what you did and I just misunderstood)? I would expect a big difference.
The distance between the reference microphone and iPhone (~1mm) is less than 1/10 of a wavelength, even at 20 kHz (~17mm), for the express purpose of reducing the kind of reflections you seem to be concerned with. This is a pressure sensitivity measurement, which means that the acoustic pressure is assumed to be constant in the small space between the microphones. The microphone spacing was chosen for this intended measurement over the audible frequency range.
Thanks for the answer. I think that the response of a reference microphone with an iPhone in front of it is different from the frequency response of an iPhone with a reference microphone in front of it and that’s what you seem to be comparing. It’s also not obvious if you are assuming 0 degrees for one microphone is 0 degrees for the other one when they are facing each other. Microphones are not perfect point measurement devices and I think that obscuring them with different objects is likely to give different results.
This measurement approach is based on the method of “pressure calibration by comparison” from IEC 61094-5. There are clearly challenges with the shape of the iPhone vs the shape of the reference microphone. The standard assumes that 2 microphones of the same shape and size are being compared.
However, the surprise I expressed in my first comment is due to the difference between the iPhone 17 Pro mic and the iPhone 15 Pro and iPhone 16 Pro mics (which were much more similar to each other). In all 3 cases, the same measurement procedure was used, so despite the imperfections in the measurement method itself, I expected the iPhone 17 Pro to more closely match previous models. The differences could be due to the iPhone 17 Pro’s mechanical design (which does differ) or the MEMS microphones themselves.
I still plan to follow up with additional measurements to explore the challenge of measuring a microphone embedded in an iPhone.