
How to Manually Adjust the Data Scale in SignalScope
Most tools in SignalScope include some kind of plot (graph) with an adjustable scale for viewing time or frequency domain data. Although each plot typically features one or more options for automatic scaling of the data, it is helpful to know that there are multiple ways to adjust the scale manually.
The vertical axis (typically representing amplitude or magnitude) can be adjusted by multi-touch gestures, selections from the display options menu, or via keyboard commands (which have corresponding menu commands when SignalScope is run on macOS). Similar adjustments may be made to the horizontal axis scale, depending on the kind of data presented by the selected tool.
The instructions which follow will assume that Autoscale has already been turned off in the display options menu of the selected tool.
Multi-touch Gestures
SignalScope has long featured the option to “touch your data” through multi-touch gestures on iPhone and iPad. This includes manually adjusting the plot scale with gestures inside the axis label area (where the axis title and division labels are found), as well as a “smooth zoom and pan” via gestures inside the main graphing area of the plot. The gestures, below, apply to touch screen devices, such as iPhone and iPad, but can generally be accomplished on the Mac with a trackpad (single figure gestures can typically be performed with a mouse).
Inside the Axis Label Area
2-finger Pinch: The vertical scale may be adjusted up or down by placing 2 fingers inside the vertical axis label area and moving the fingers toward each other (pinching) or moving them apart (spreading). This is illustrated, below.

1-finger Drag: For plots and scale options that support vertical offset, the offset may be adjust by placing a single finger in the axis label area and dragging it up or down.
1-finger Double Tap: The result of this gesture will vary among analysis/plotting tools. In the Osilloscope tool, a double tap will reset the vertical offset.
In spectrum analysis tools, a double tap will typically toggle the Autoscale function on and off (which makes it useful when you just need a quick automatic scaling when you are otherwise working with manual scale adjustment).
When adjusting the magnitude scale in the Spectrogram tool, the gestures should be applied to the color scale bar graph (note that the color scale can optionally be hidden via user selection in the Spectrogram Display Options Menu).
Inside the Graphing Area
2-finger Pinch: In several tools, you can zoom in on the plotted data by using a 2-finger spread gesture within the graphing area. A 2-finger pinch gesture will zoom out again.
2-finger Drag: While zoomed in on the data, you can drag 2 fingers to pan around the data, as illustrated below.
1-finger Double Tap: While zoomed in on the data, a double tap will reset the graph to its normal state (no zoom).
Scale Selections
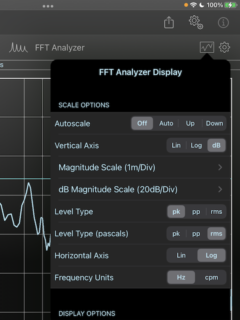
Most tools in SignalScope feature a Display Options Menu, which can be accessed by tapping on the Display Options icon in the selected tool’s toolbar. The scale factor is specified by some quantity per division of the graph (e.g. 12 dB/Div). There are typically 10 divisions in a graph, though this can vary for different types of graphs and data scales in SignalScope.

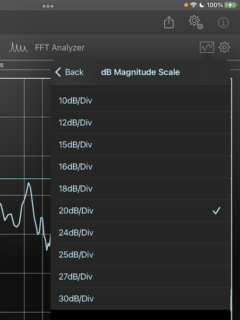
In the Display Options Menu, you will generally see 1 or 2 options for vertical scale selection. Tools, such as the FFT Analyzer, which support decibel (dB) scaling of the data will have submenus for both non-dB and dB scale data. Once you have entered the scale selection menu, you can simply choose the desired scale factor from a list.
Keyboard Commands
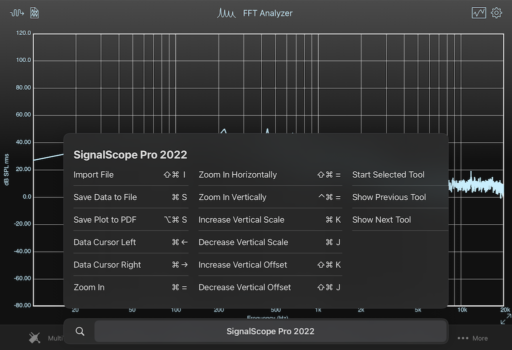
Although keyboard commands are typically associated with selections from the main menu bar on the Mac, they are also available on iPad and iPhone when a keyboard is connected. In fact, with a keyboard connected to your iPad, if you hold down the Command Key (⌘) you will be presented with a list of available keyboard commands (see the image, below). The list of available commands can vary depending on the current context (selected tool, scale type, scale factor, etc).
Below is a list of relevant SignalScope View menu commands, with their corresponding keyboard commands, that you will see on the Mac. As mentioned above, each will be enabled or disabled depending on the context.
- Increase Vertical Scale (⌘K)
- Decrease Vertical Scale (⌘J)
- Increase Vertical Offset (⇧⌘K)
- Decrease Vertical Offset (⇧⌘J)
- Zoom In (⌘=)
- Zoom Out (⌘-)
- Zoom In Vertically (^⌘=)
- Zoom Out Vertically (^⌘-)
⌘ = Command Key, ⇧ = Shift Key, ^ = Control Key
Choosing to increase or decrease the scale via keyboard command (or Mac View menu selection) will simply choose the appropriate next scale factor from the same list that can be accessed from the Display Options Menu (see above).
If you have questions or comments, please leave a comment on this post (comments will be added to the forum), or contact us.
