
SignalScope 12.1 brings new features to the Spectrogram
Several new features make SignalScope’s Spectrogram tool more useful than ever. These most-requested features include:
- User-defined minimum and maximum frequency limits in the Spectrogram, just like in the FFT Analyzer tool
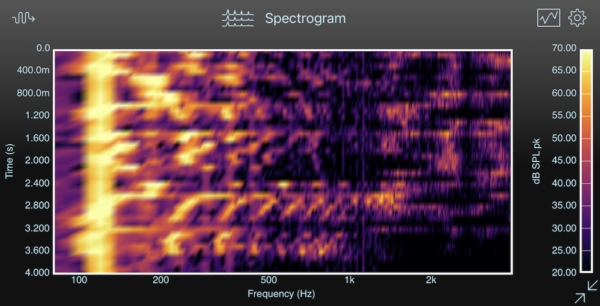
- An option to set the Spectrogram’s vertical axis to time, with frequency across the horizontal axis, similar to a traditional waterfall plot or LOFARgram (low frequency analyzer and recorder)
- An Auto Stop option to have the Spectrogram analysis stop after a user-definable period of time (regardless of the current selected time scale)
- Exported Spectrogram magnitude data will be stored as decibel values when the dB scale is selected in the tool’s display settings
This update also includes support for the latest Digiducer USB Digital Accelerometer models, as well as cosmetic and minor under-the-hood improvements.
SignalScope X version 12.1 is available for download on the App Store for Mac, iPhone, and iPad, now. Check it out!
