
Measured: Apple Vision Pro microphone directivity and frequency response
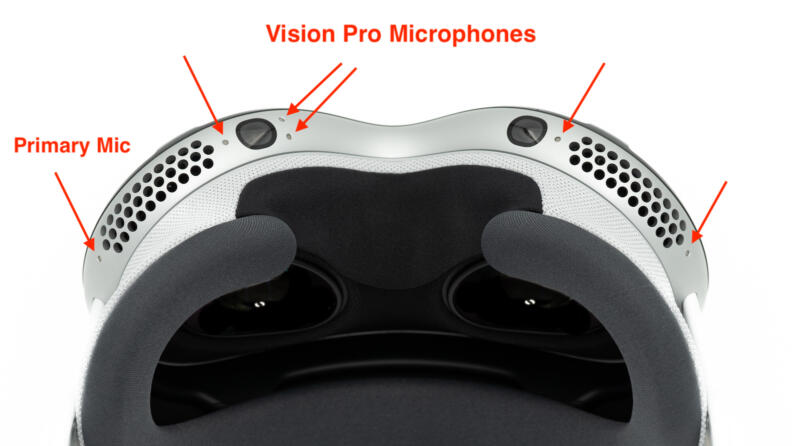
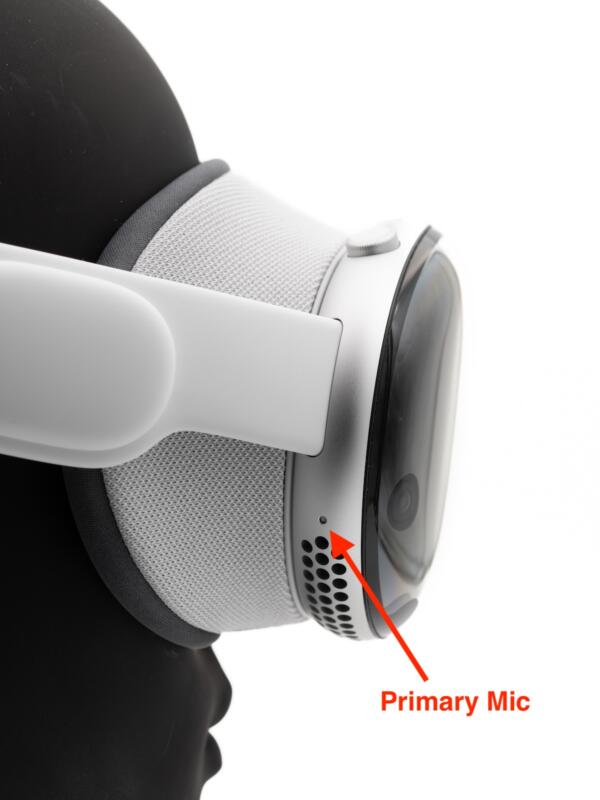
Since SignalScope is available on Apple Vision Pro, it is important to understand the behavior of the Vision Pro’s built-in microphone to make the most of it. Although Apple states that the Vision Pro actually has a “Six-mic array with directional beamforming,” SignalScope only has access to one of these microphones–the one nearest to the right ear of the wearer. In order to avoid processing of the microphone signal by the operating system, to provide the highest quality signal for measurement purposes, SignalScope uses a ‘measurement mode’ offered by iOS/visionOS. According to Apple’s documentation, when capturing the microphone input “on devices with more than one built-in microphone, the session uses the primary microphone.” (https://developer.apple.com/documentation/avfaudio/avaudiosession/mode/1616608-measurement/) On Vision Pro, we confirmed through our own testing that the “primary microphone” is located on the right side of the device (from the wearer’s perspective).
Directivity
The location of the microphone means that sound will be better received by the microphone when the sound is coming from the wearer’s right side, especially at higher frequencies. Higher frequencies have shorter wavelengths and when the sound encounters an obstacle (in this case a human head) that is larger than the wavelength, less of the sound will reach the other side of that obstacle. The way a microphone receives sound from different directions can be described by its directivity (sometimes referred to as its polar response or polar pattern).
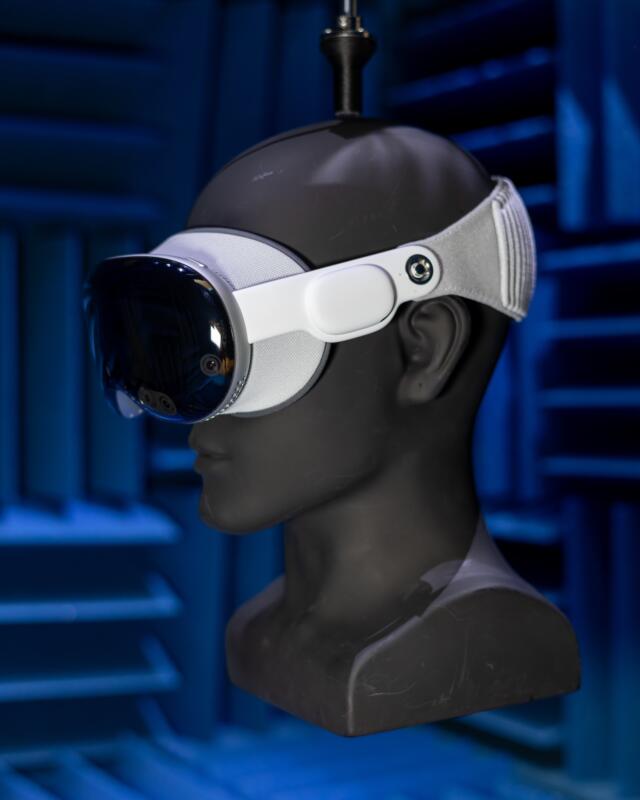
To get a better understanding of the directivity of the Vision Pro’s microphone, we mounted it on a dummy head inside our anechoic chamber and measured the sound from a loudspeaker pointed at the front center of the Vision Pro from different angles (in 1.5 degree increments). The directional behavior of the Vision Pro is shown in the polar plots, below, which were created in SignalScope.
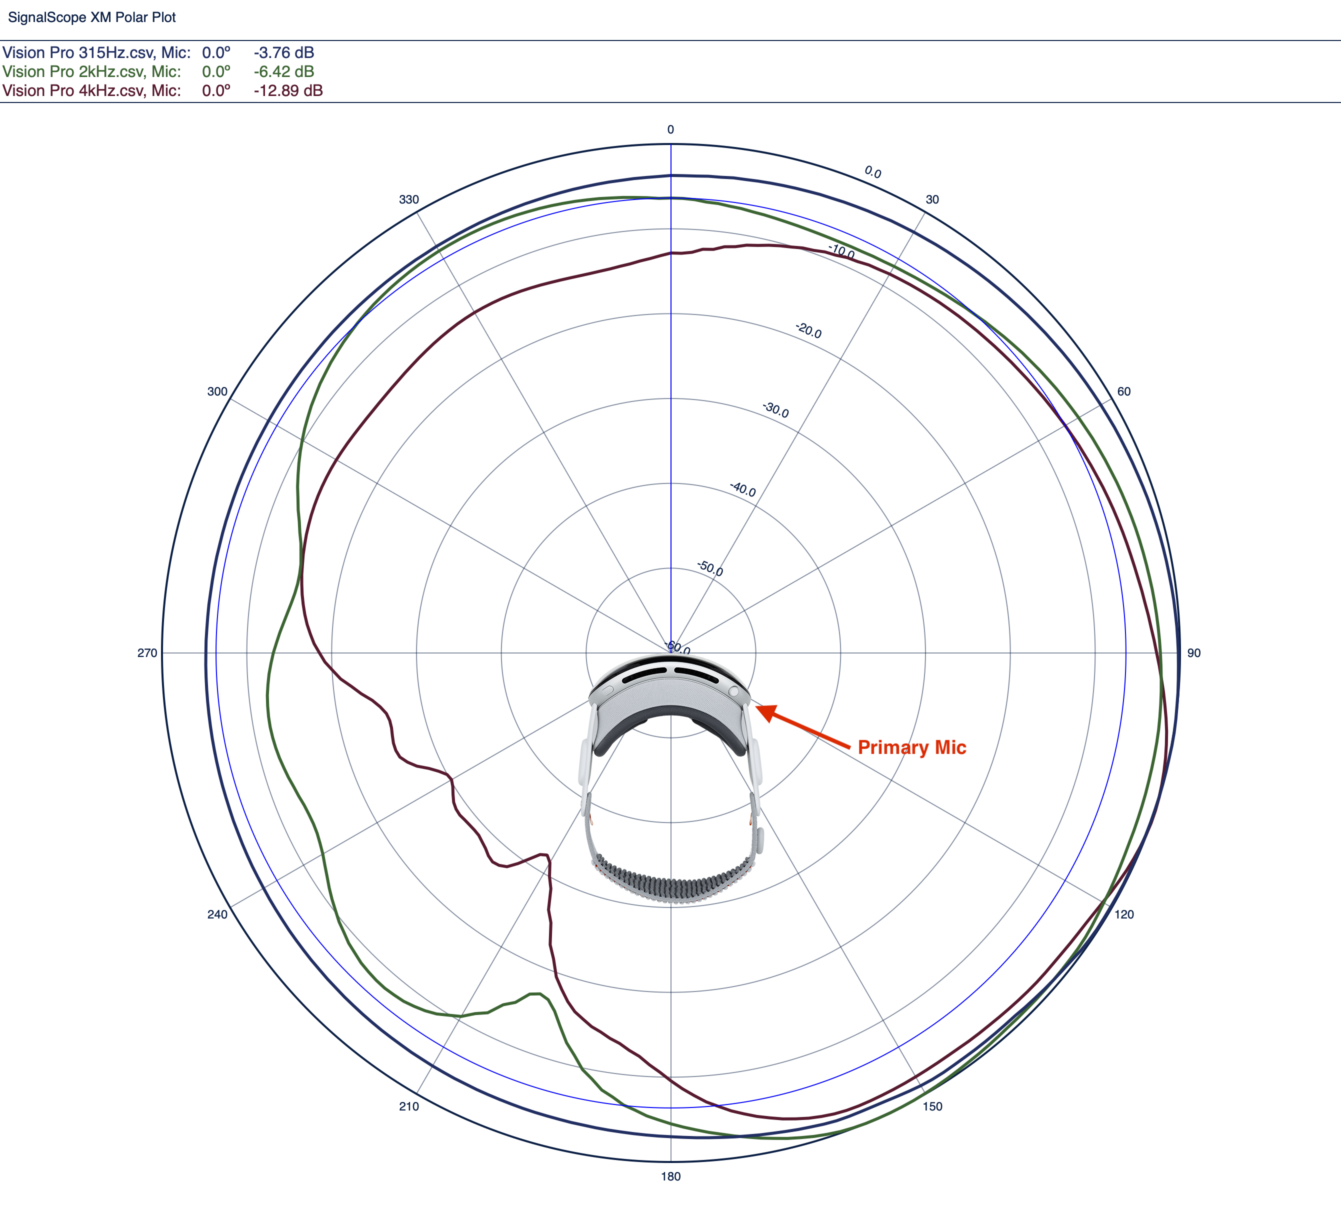
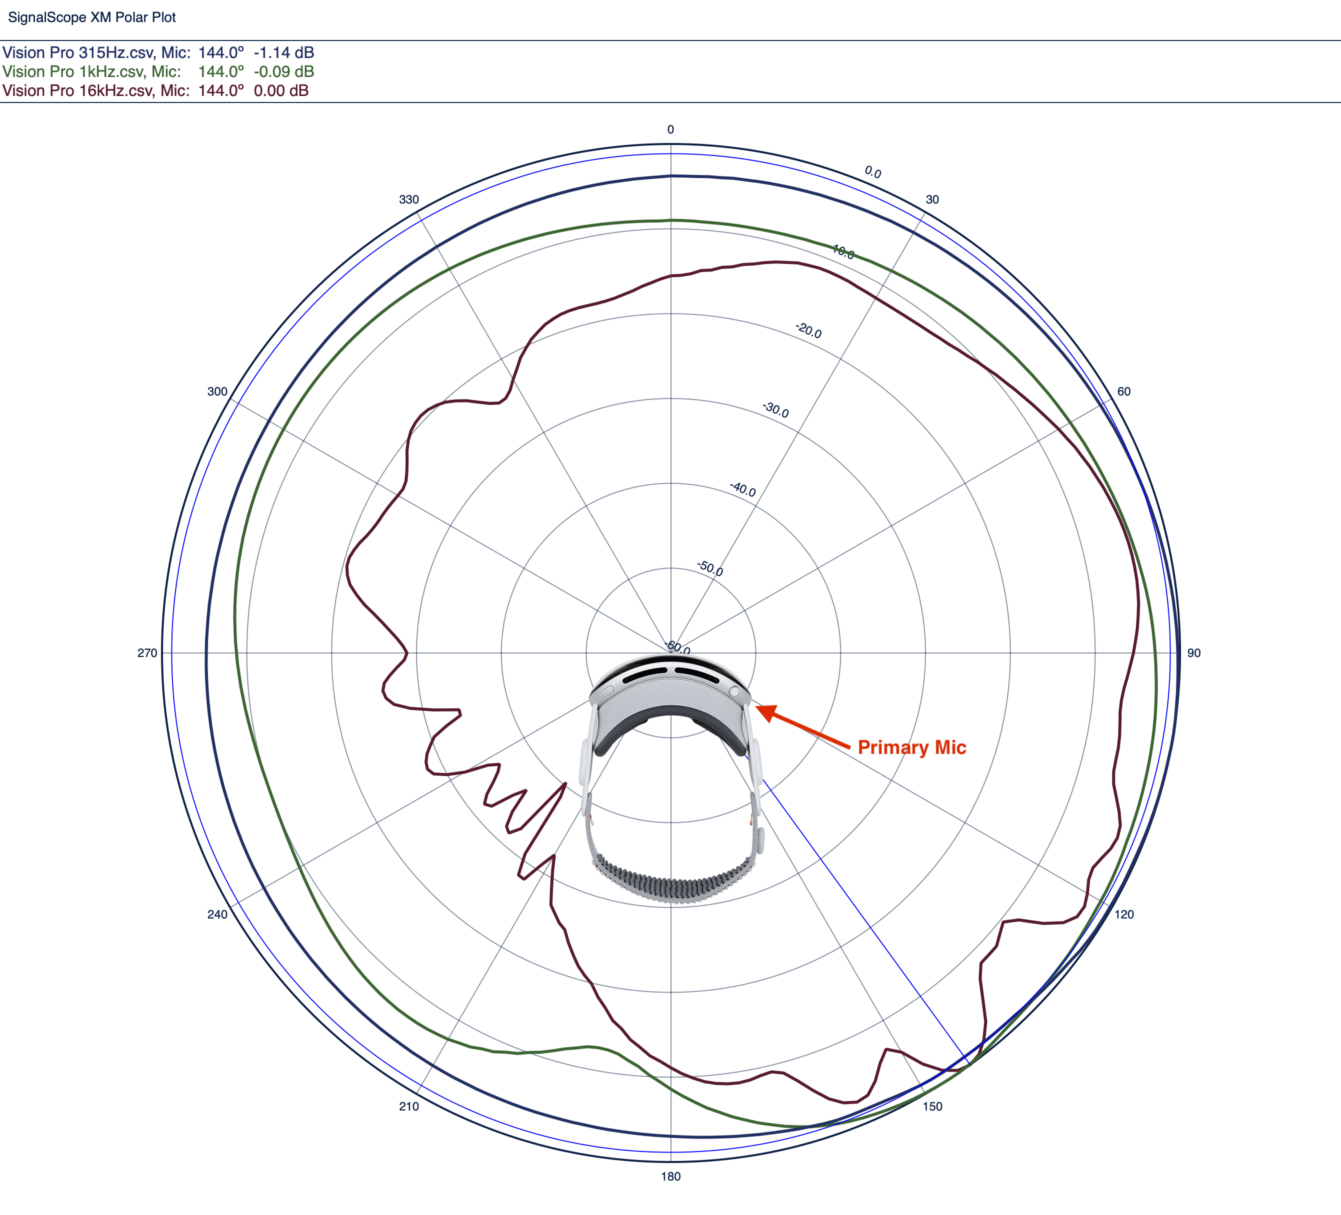
The polar plots make it plain to see that the sound is stronger when the sound source (loudspeaker) is on the right side of the wearer. At frequencies in the 16 kHz frequency band, sounds coming from the left and behind the wearer can be as much as 40 dB (!) lower than the same sounds coming from the right. For reference, it is generally accepted that a sound will be perceived as half as loud when its level decreases by 10 dB. This means that sounds coming from the left and behind the Vision Pro can be as much as 1/16th as loud as sounds coming from the other side! Of course, this issue could easily be addressed by Apple, if visionOS were adjusted to allow apps to individually access additional microphones, rather than just a single mic.
Frequency Response
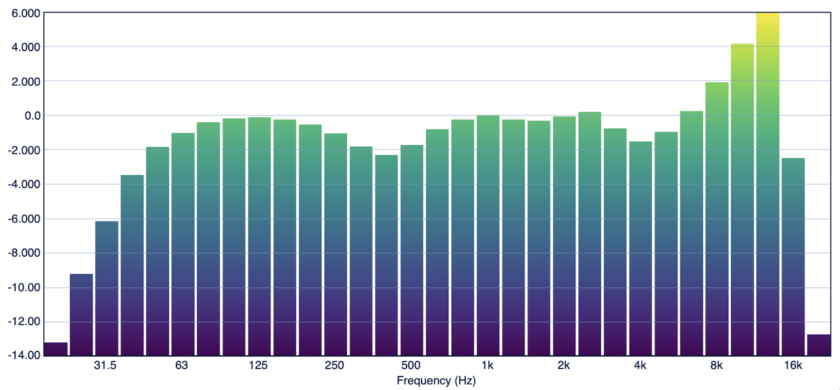
In order to measure the frequency response of the Vision Pro microphone, a lab-grade microphone (PCB model 378B02 1/2-inch pre-polarized free-field condenser microphone) was positioned facing the Vision Pro mic less than 5mm away from it. The speaker was behind the PCB mic, facing the Vision Pro. The 1/3-octave spectrum was measured for each microphone. Then, the Vision Pro and PCB mic were rotated 180 degrees, keeping the same orientation and position relative to each other, and the sound spectrum was measured again. For each angle, a frequency response was calculated in 1/3-octave frequency bands between the 2 mics. Then, the 2 resulting frequency response measurements were averaged. The result is shown in the following graph, which was created in SignalScope.
A Note to Developers
These tests were performed with visionOS 1.2 using AVAudioSession.Category.playAndRecord (or AVAudioSessionCategoryPlayAndRecord in Objective-C). SignalScope uses AVAudioSession.Mode.measurement to avoid any extra signal processing by the system.
We tested the microphone input with other AVAudioSession.Mode values, as well. The right microphone was the only microphone available for audio input (recording) when the following modes were selected:
- default
- measurement (the default mode used by SignalScope)
- videoRecording
- voicePrompt
For these other modes, other microphones were used with Apple’s own signal processing. It’s not surprising that all of these modes are related to speech (chat), which implies that the signal processing applied to the various mics is intended to enhance speech intelligibility (beamforming, noise reduction, etc).
- gameChat
- videoChat
- voiceChat
- spokenAudio (with this one, the right mic was clearly dominant, but there seemed to be some contribution from the other mics despite the fact that the audio system still only presented a single channel for audio input)
Again, it’s important to note that in all cases, the audio system only made a single microphone input channel available for use by the requesting app. It’s possible that other results may be obtained by using values for AVAudioSession.Category other than playAndRecord.
As noted in the previous post, SignalScope apps can be downloaded on the Apple Vision Pro spatial computer.

Pingback: SignalScope 12.5 brings improved support for Vision Pro – Faber Acoustical Blog
Pingback: Measured: iPhone 15 Pro Max microphone frequency response and directivity – Faber Acoustical Blog