
Real-time 3D Spectrogram now available in SignalScope for iOS
Faber Acoustical is pleased to announce that a live Spectrogram tool is now available for purchase within SignalScope and SignalScope Pro. The Spectrogram tool is offered in both 2D and 3D versions. The 3D Spectrogram includes all the functionality of the 2D version and adds powerful hardware-accelerated 3D plotting capabilities including a live 3D surface plot. A 3D upgrade is available to those who opt to purchase the 2D version.
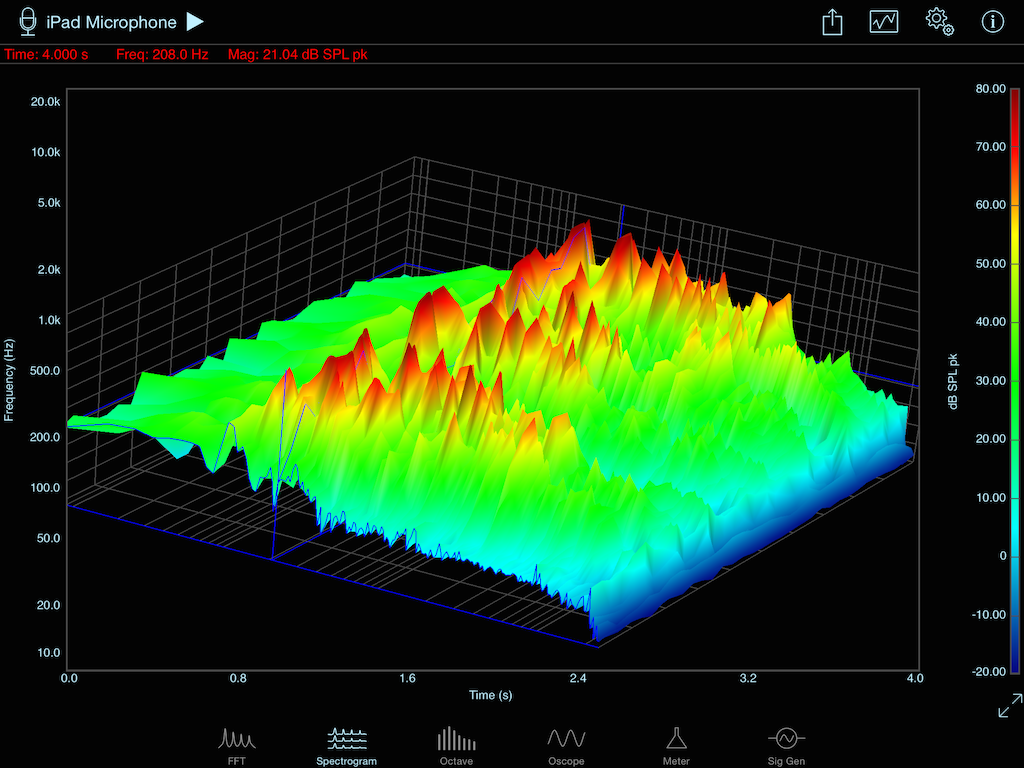
The real-time Spectrogram plots FFT-based spectral data versus time in a colorful surface plot. Signal magnitude at each time and frequency is represented by color. Use single-finger tap and drag to place a data cursor within the plot. When the cursor is visible, details regarding time, frequency, and magnitude will be displayed above the plot.
Main Features (available in both versions of the Spectrogram tool:
- Frequency resolutions between 1 Hz and 50 Hz, depending on sample rate, may be specified for audio input (between 1 Hz and 10 Hz for the built-in accelerometer).
- Input data can be windowed with one of 7 different FFT data window types.
- Spectrogram data can be captured over time periods ranging from 2 to 20 seconds.
- Lin, log, and dB magnitude scales with Up, Down, or Full auto-scaling.
- Lin and log frequency scales.
- Fractional-octave band frequency smoothing in 1/6, 1/12, and 1/24-octave bands.
- Cursor peak track can track peaks in time, frequency, or both.
- Color scale bar graph enables manual adjustment of magnitude scale and offset. The color scale can also be hidden.
- Data may be exported to CVS, MAT, or TXT files for post processing or plotting. Optionally, include GPS location information with exported data. (The data export option is included in SignalScope Pro. It requires the Data Acquisition upgrade, sold separately, in the standard version of SignalScope.)
- Optionally save a high-resolution PDF file of the spectrogram plot, or save an image to your Photos library.
3D Spectrogram Features:
- Choose between 2D and 3D surface plots. Each plot can be drawn live (in real time).
- Trackball-style 3D rotation of the 3D surface plot, just by dragging a single finger across the plot.
- Tap with a single finger to place a cursor within the 3D plot.
- In 3D, the cursor outlines the time and frequency slice associated with its current location.
- Optional grid planes for each axis (magnitude vs. frequency, magnitude vs. time, and frequency vs. time) are drawn at the bounds of the 3D plotting region.
- By default, the 3D spectrogram is drawn as a surface and magnitude values are represented by both position and color. The surface can be turned off, which allows data to be drawn only as a mesh.
- The 3D spectrogram data can be seen as a solid-colored mesh (the mesh draws nothing between its lines or points). The mesh can be overlaid on the surface or drawn alone.
- The mesh can be drawn as lines in time, lines in frequency, or lines across both time and frequency. It can alternatively be drawn as a series of dots, each one representing a single spectrogram data point.
- When only viewing the 3D spectrogram data as a mesh, the time and frequency slices outlined by the cursor show through the mesh, making it very easy to see them in the midst of the rest of the data.
Also new in SignalScope and SignalScope Pro:
- GPS coordinates, altitude, and accuracy may now optionally be saved with FFT, Spectrogram, or Oscope data when exporting to a data file (Data Acquisition Upgrade required in SignalScope).
- Downloaded frequency response data for connected microphones will automatically be saved in a file in the Frequency_Response_Data folder to make it easier to access at a later time.
- Smarter selection of the maximum frequency when FFT data smoothing is enabled.
- Fixed an issue with Full Autoscale in the FFT analyzer.
- Other minor cosmetic improvements and bug fixes.